
Data 
The aim of the VPDrought experiment is to disentangle the processes influenced by air dryness – in particular by vapor pressure deficit (VPD) – and soil dryness. A multitude of measured parameters provides detailed information on the carbon and water balance of the trees under the following treatment variants: control, irrigation, drought, irrigation+VPD and drought+VPD. Data on environmental factors on the one hand and the responses of trees and the ecosystem on the other hand enable us to analyze direct cause-effect relationships in real time and to make timely forecasts of forest conditions (nowcasting).
Below you will find examples of measurements of the most important parameters on days when the effects of the different treatments were clearly visible. Additional information and high-resolution, historical and current data series for other parameters are available under Real-time data.
Data management
The data are managed in the data base of the Swiss Long-term Forest Ecosystem Research LWF. This includes key information such as data owner, start and end of collection, resolution, data repository, and DOI if the data were published. This comprehensive system handles the measurement campaigns as well as the sensors and samplers used on the Pfynwald research platform. We apply the FAIR Data Principles, ensuring that data are Findable, Accessible, Interoperable, and Reusable. Additionally, we comply with the Open Research Data (ORD) policy of the Swiss National Science Foundation (SNSF).
- More about data flow
Relative humidity, air temperature and VPD 
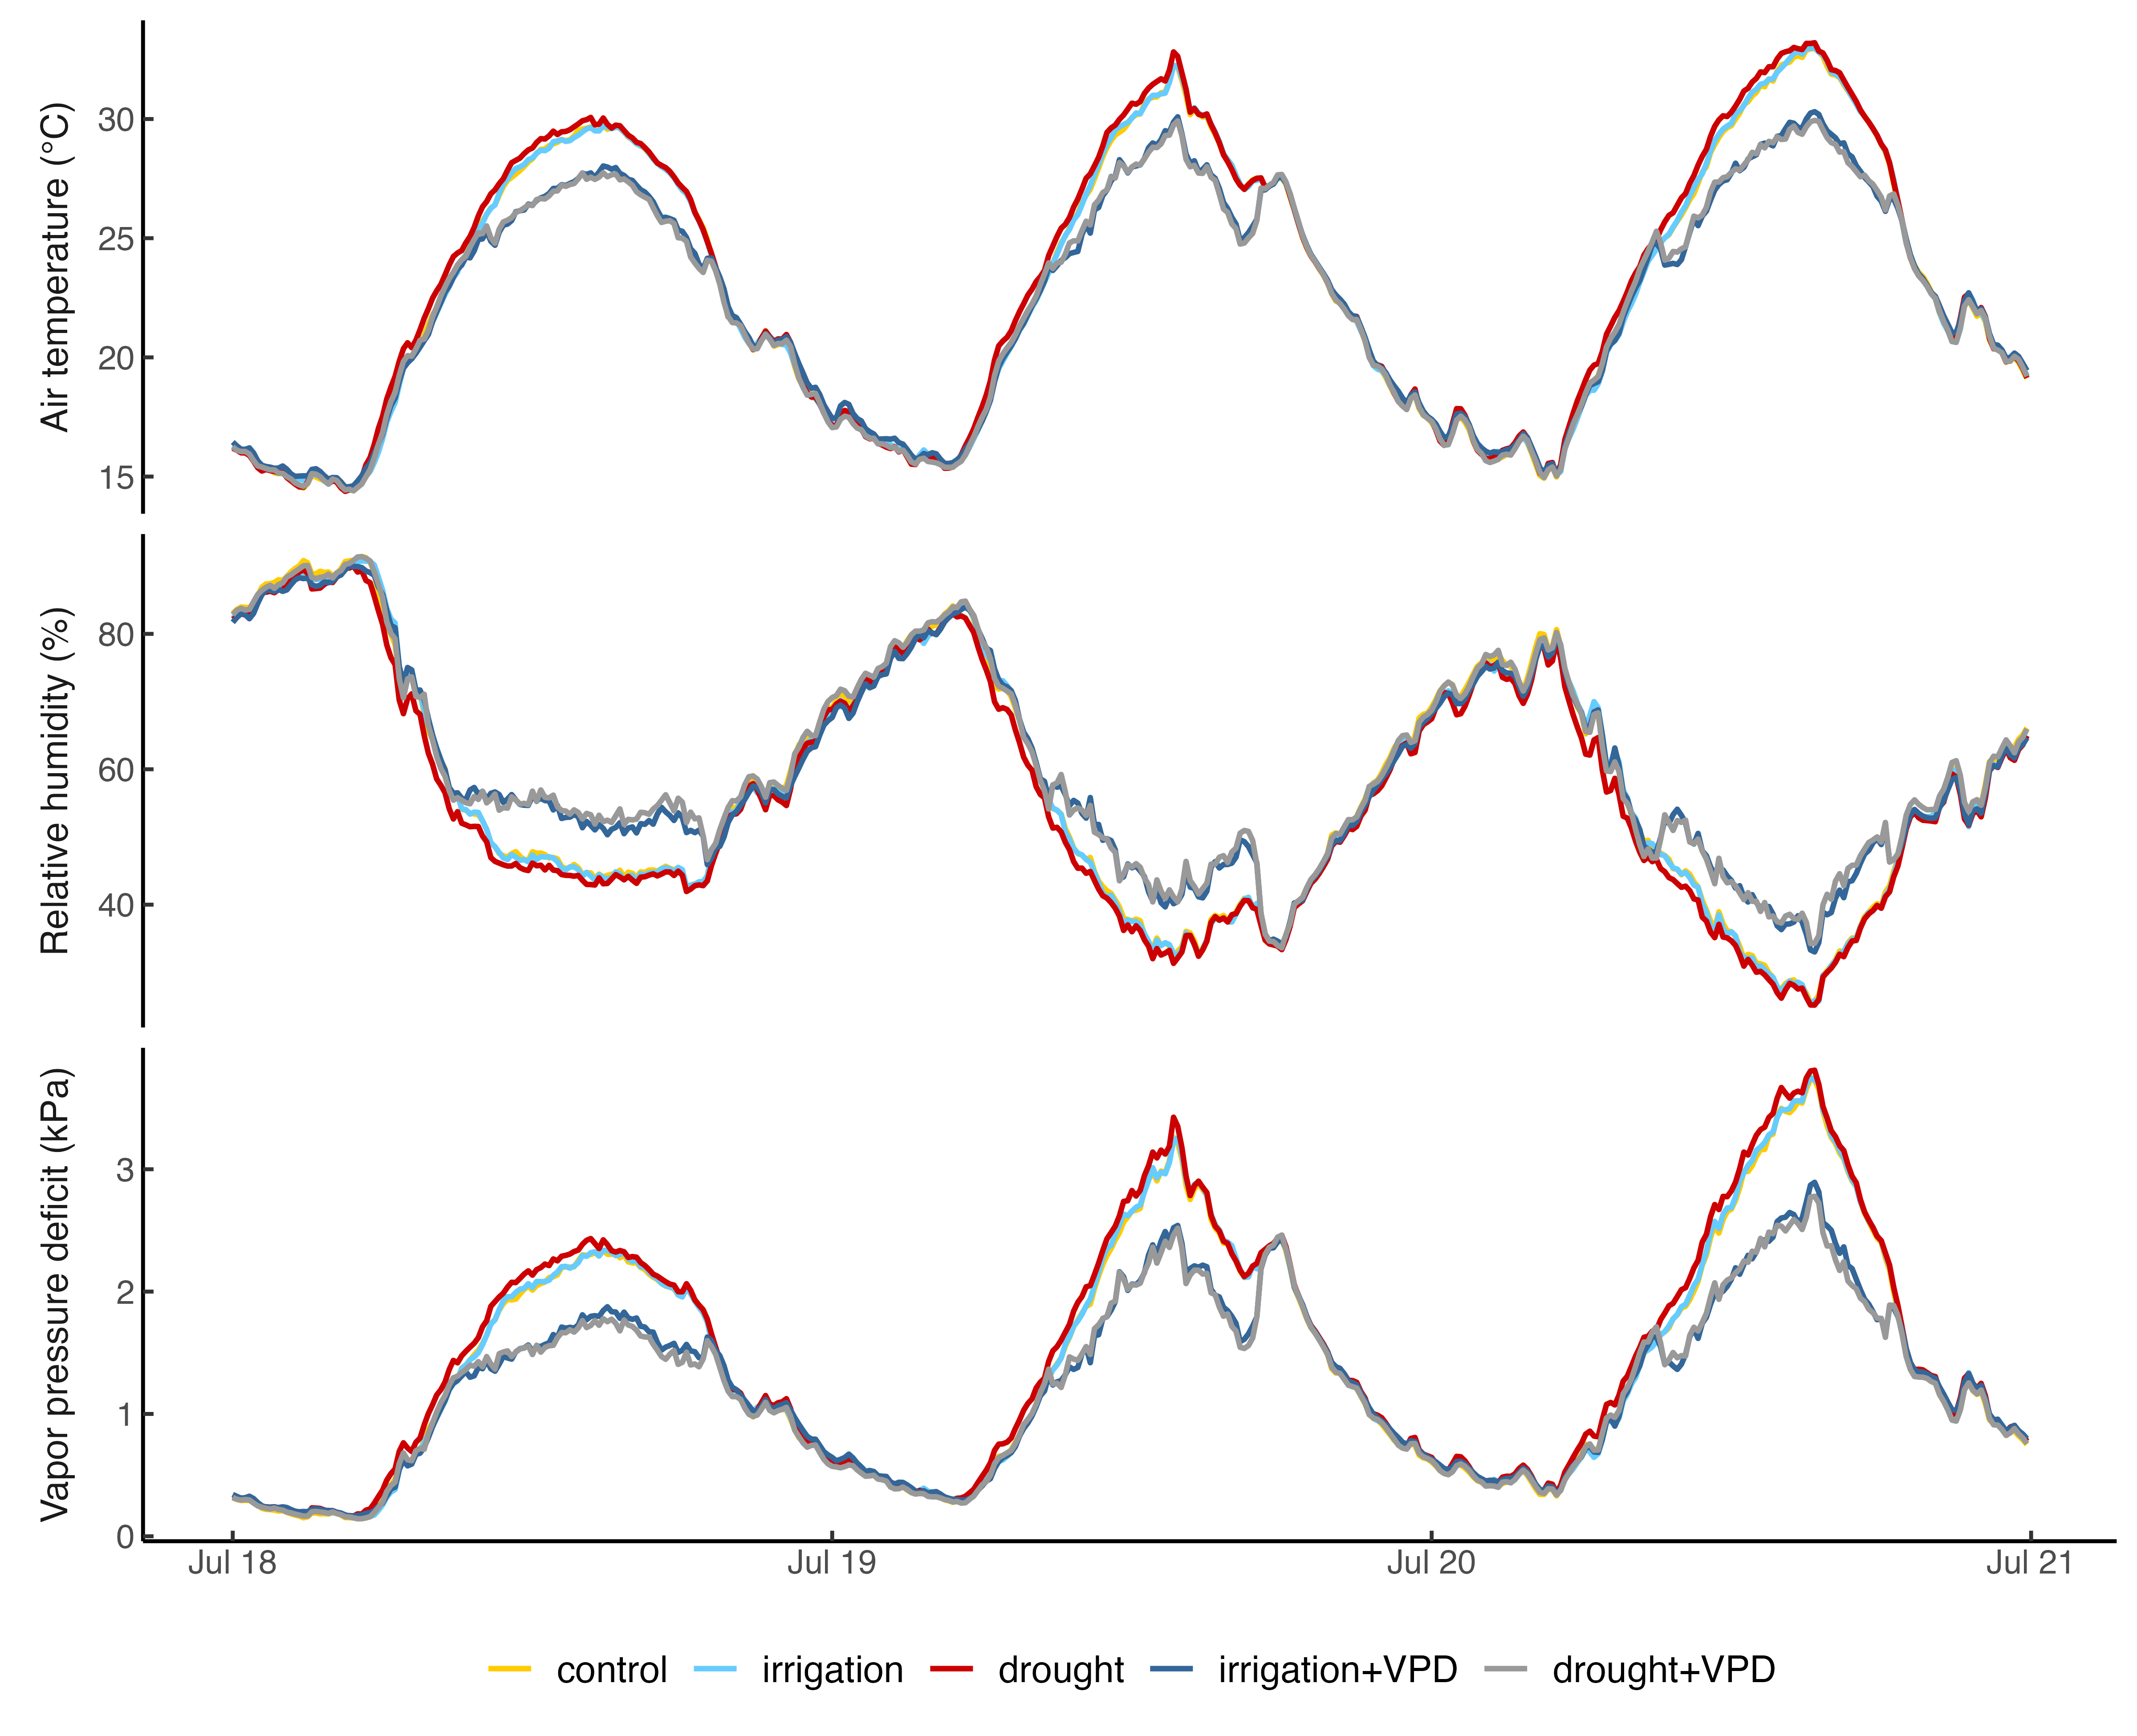
The three figures show the values for air temperature (T), relative humidity (RH) and vapor pressure deficit (VPD) on three consecutive, sunny days. The curves follow a typical daily pattern: during the day, temperatures increase and relative humidity (RH) decreases. At night, temperatures drop again while relative humidity rises. Following this cycle, the highest VPD values are measured in the afternoon and the lowest in the early morning. The two VPD treatments (irrigation+VPD and drought+VPD) result in 20-30% lower VPD values compared to the untreated crowns (control, drought, irrigation) during the treatment period.
Soil matric potential 
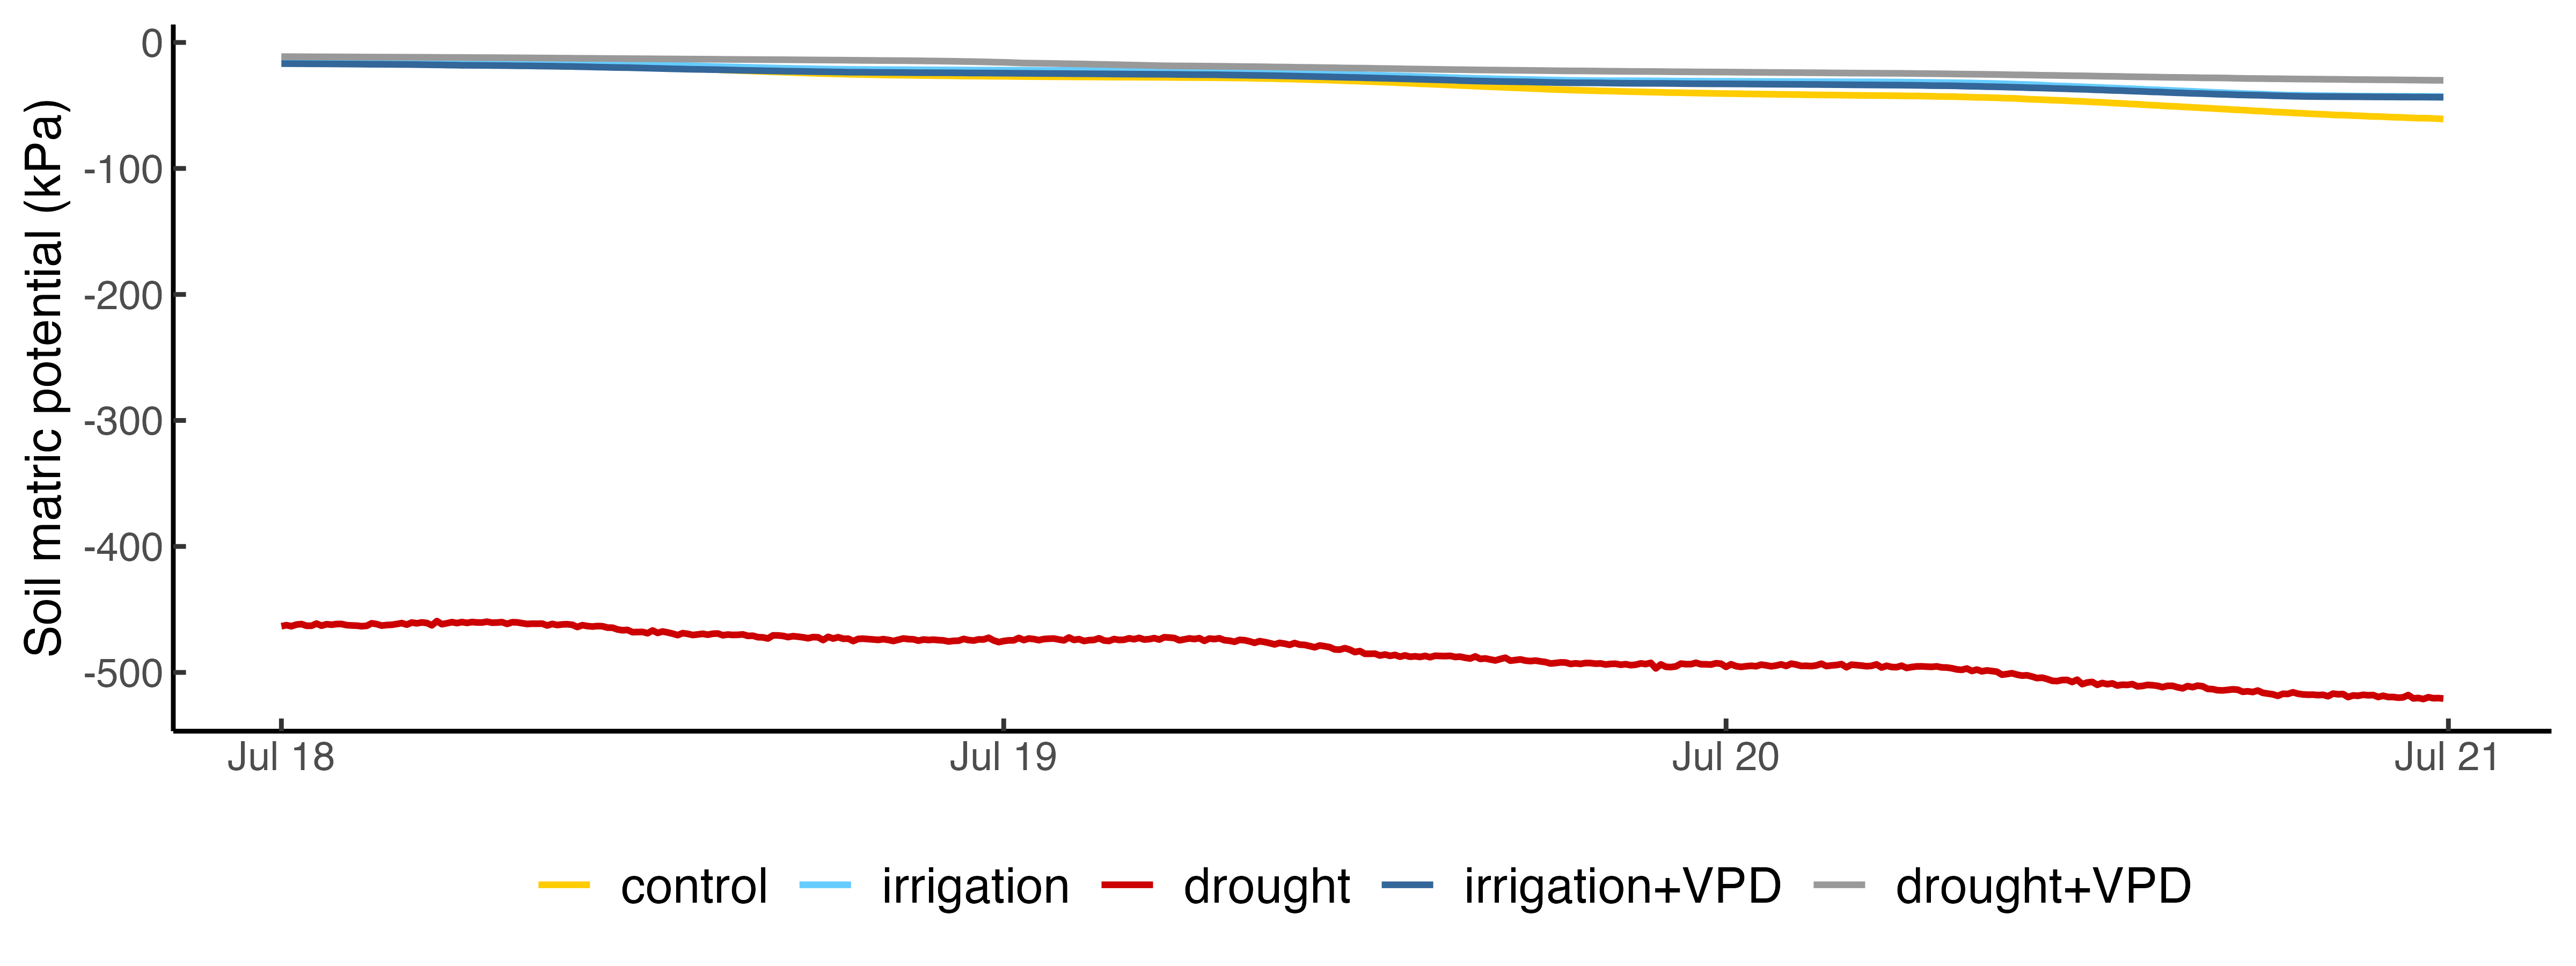
The figure shows the values for soil matric potential on three consecutive sunny days, measured at a depth of 10 cm. A low soil matric potential (very negative values) means that the water is strongly bound to the soil particles and it is more difficult for plants to absorb this water. A high soil matric potential (less negative values) means that the water is less strongly bound and more easily available to the plant roots. In contrast to the soil water content (which depends strongly on the soil texture), soil matric potential is directly related to drought stress of the plant.
The highest values were measured in the treatment "irrigation+VPD", followed by "irrigation", i.e. a low binding of soil water due to a higher water availability. With increasing drought in the "control", "drought+VPD" and "drought" treatments, the soil matric potential decreases; the more negative the values, the higher the binding of soil water. For example, in the "drought" treatment, tree roots have to overcome a negative pressure of 80 kPa in order to take up water from the soil.
Tree water deficit and sap flow 
Tree water deficit (TWD) occurs when a tree takes up less water than it loses through transpiration. This can affect photosynthesis in the short term and growth in the long term. Severe water deficits can lead to hydraulic failure, which blocks water transport and in the long term can damage or even kill the tree.
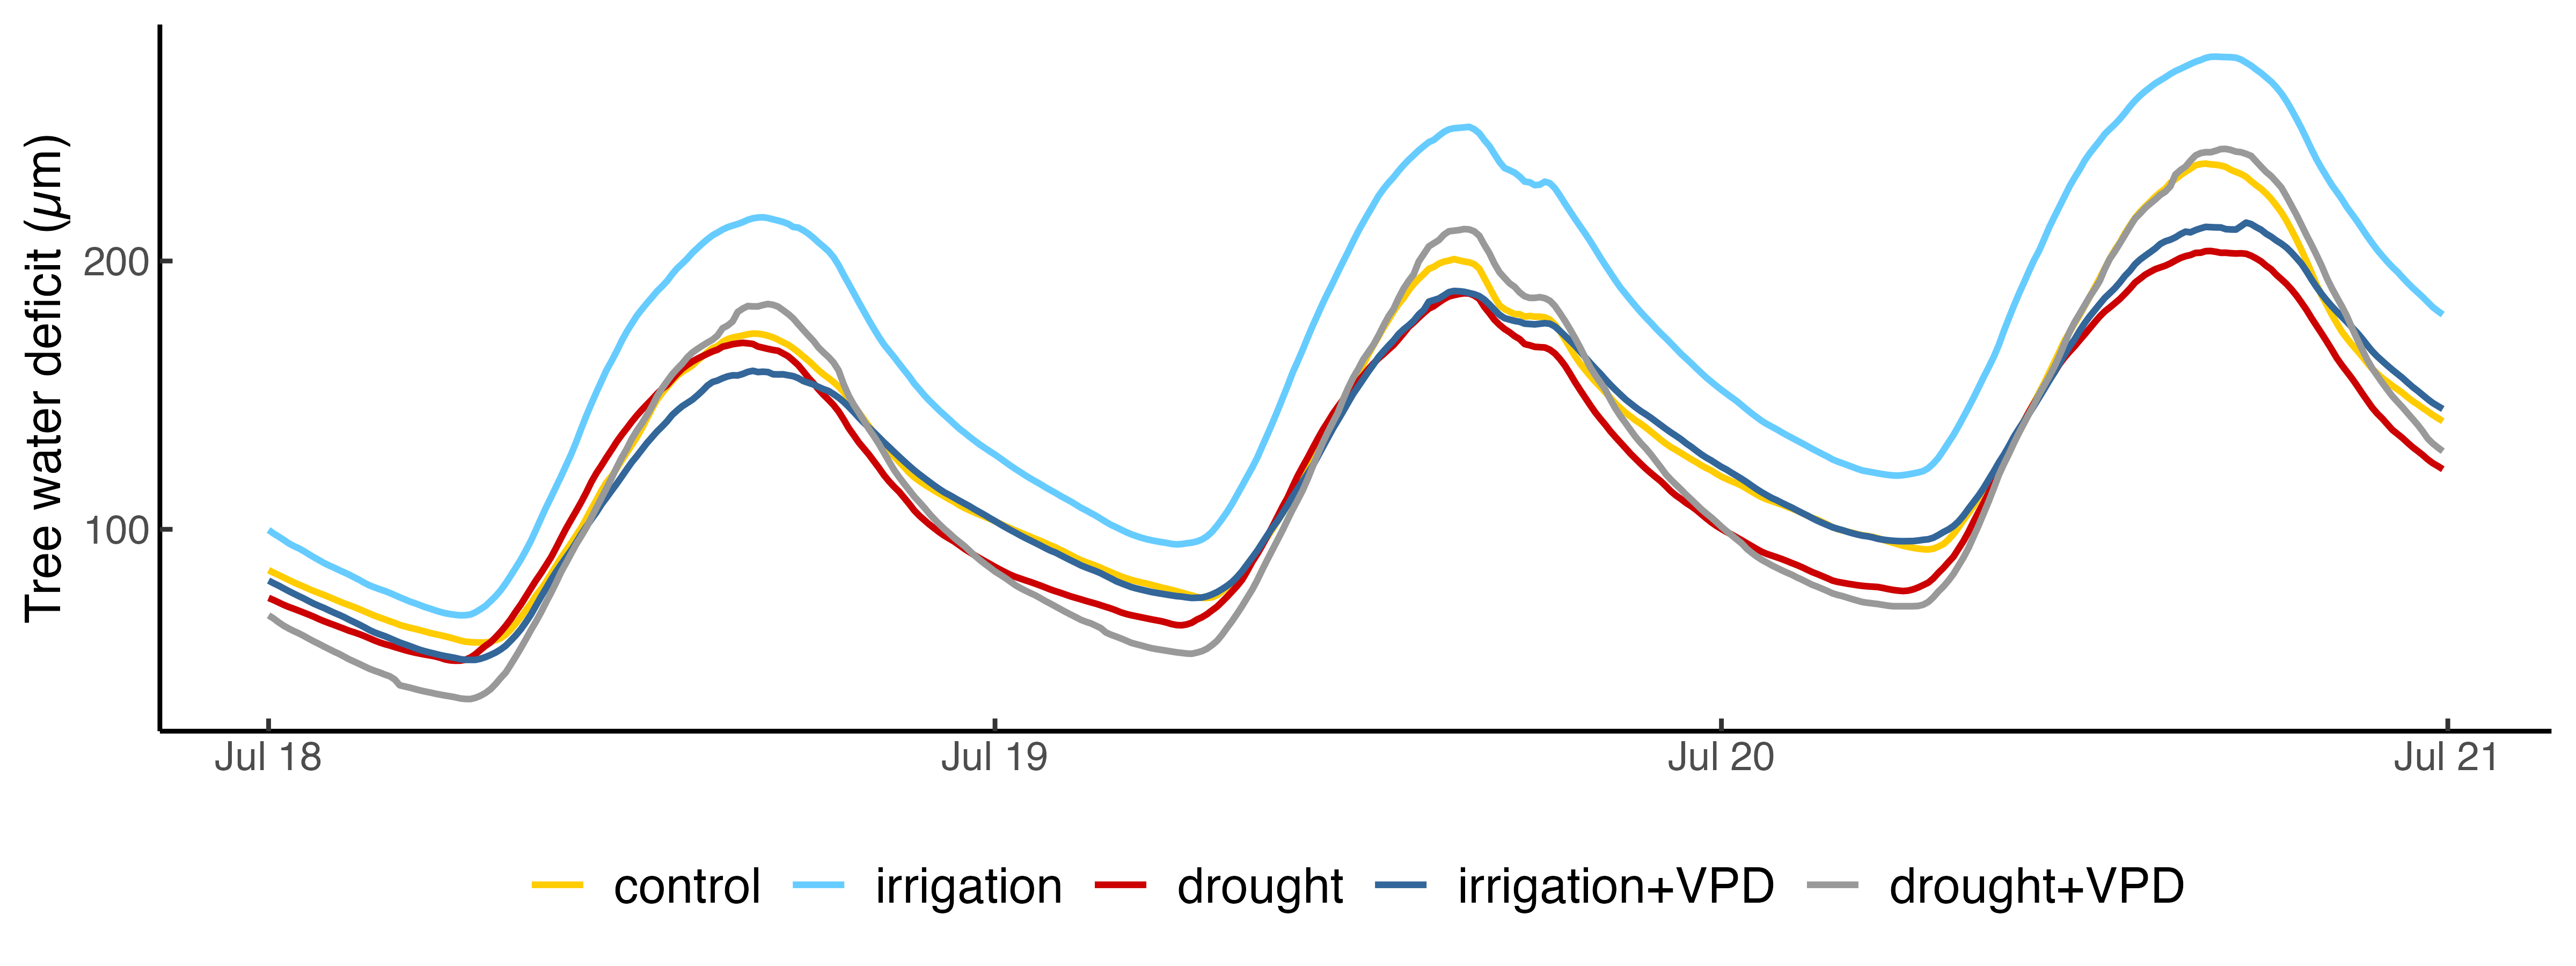
The figure shows the daily fluctuations in tree water deficit on three consecutive sunny days. These fluctuations can be largely explained by the course of VPD. Under dry conditions and a high VPD, the Scots pines investigated lose more water through transpiration than they can absorb through their roots. The Scots pines that are affected the most are those that are exposed to only 50% precipitation (see treatment "drought"), followed by the control trees with a medium tree water deficit and those trees that are irrigated (lowest tree water deficit). In addition to irrigation, the reduction of VPD ("drought+VPD" and "irrigation+VPD") in the canopy also helps to further alleviate tree water deficit.
Taken together, the point dendrometer and sap flow measurements provide a high-resolution and comprehensive insight into the mechanisms by which trees respond to increasing soil and atmospheric drought and how the forest ecosystem adapts to changing environmental conditions over time.
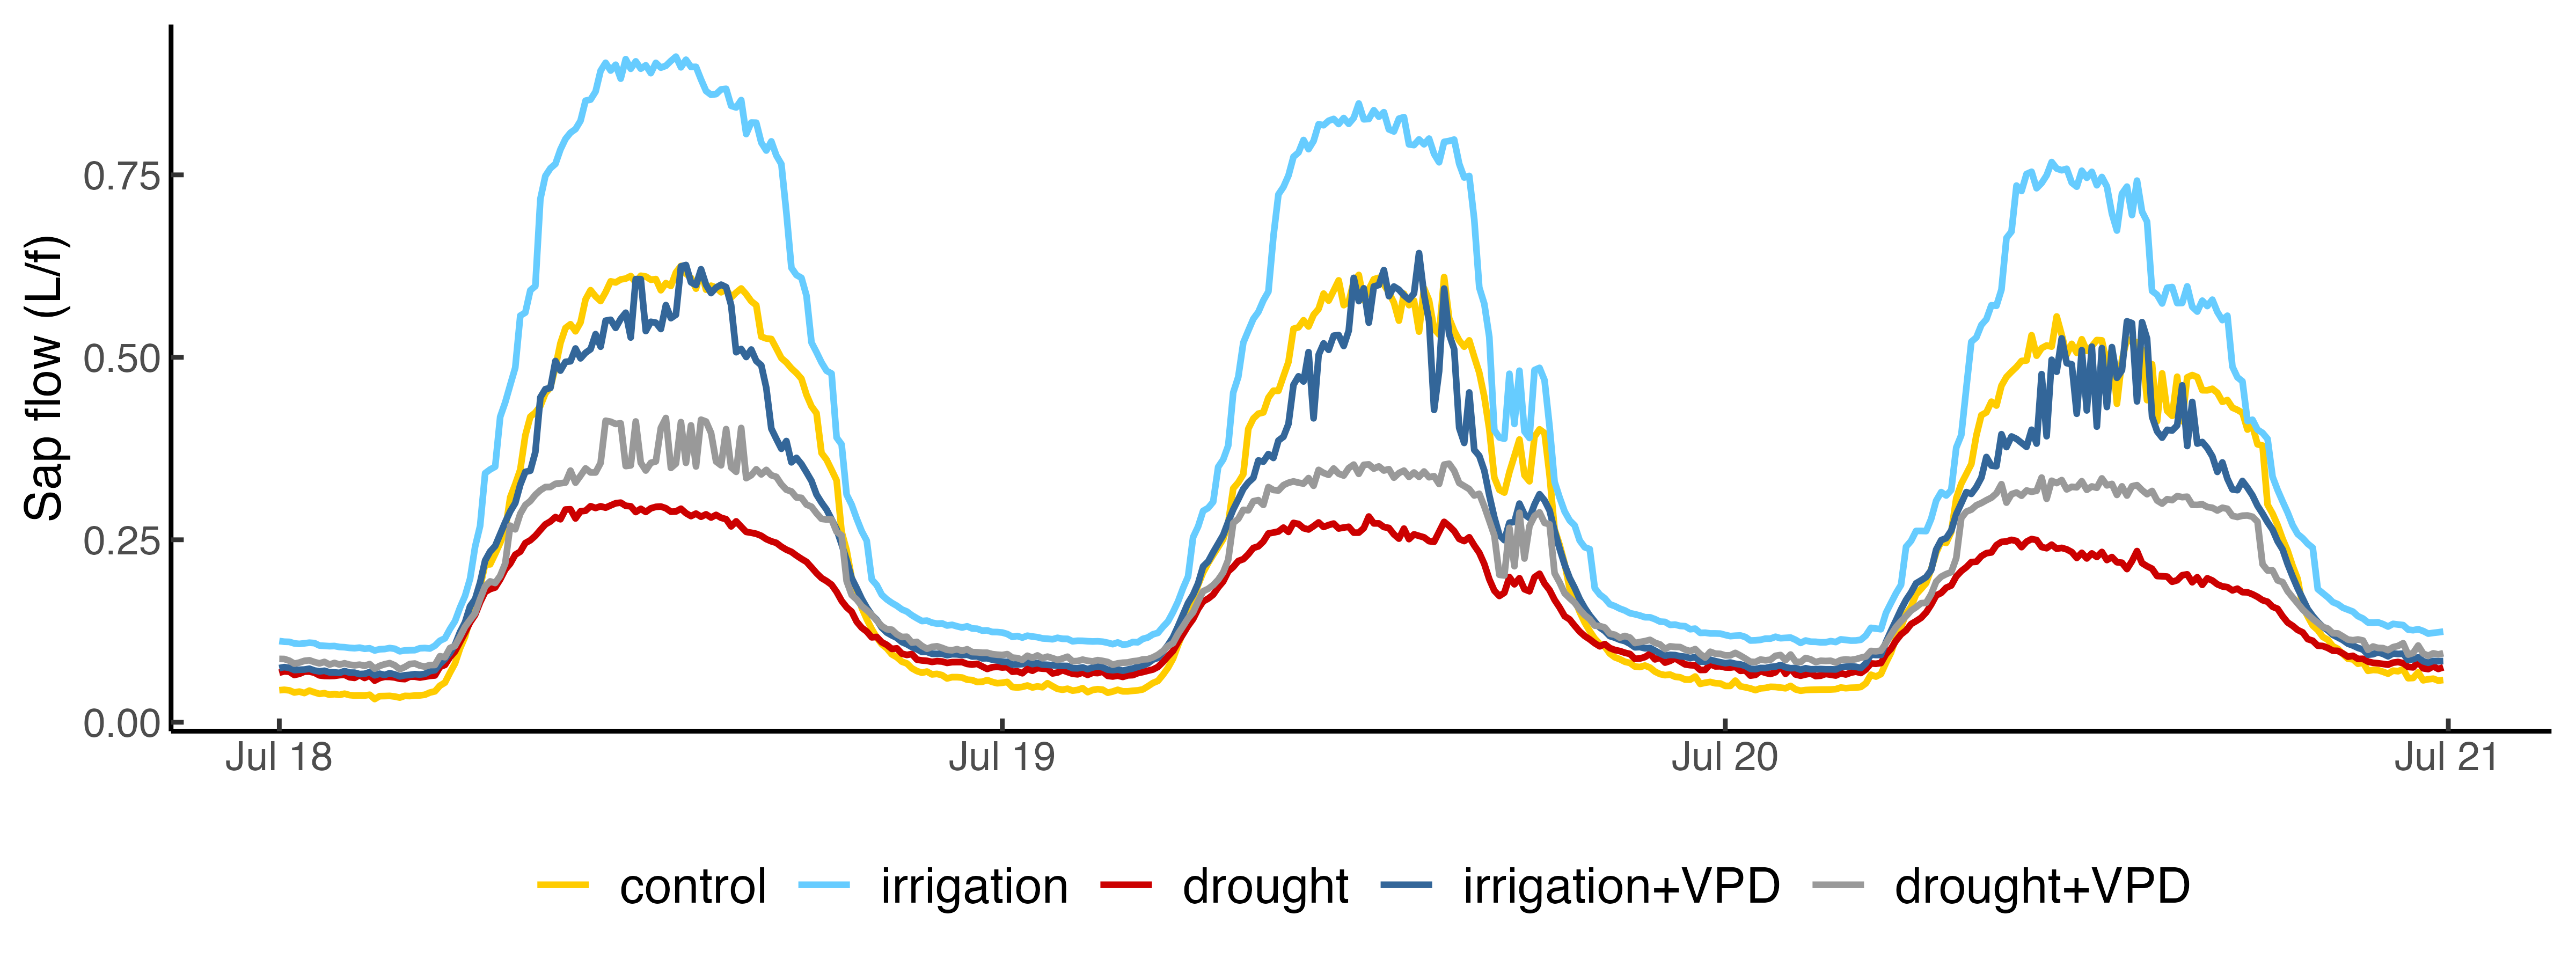
The figure shows the sap flow of 45 Scots pines on three consecutive sunny days. The values follow a typical daily pattern, with the highest sap flow values in the early afternoon and the lowest values at night. Sap flow data provide information about the circulation of water in the trunk, which is controlled by transpiration in the crown and water uptake by the roots. The course of sap flow under different treatments shows how the Scots pines close their stomata under dry conditions to limit water loss through transpiration.
The Scots pine trees in which 50% of the precipitation was diverted show the lowest sap flow values, followed by the control trees (100% precipitation) and the irrigated trees (200% precipitation). The Scots pine trees in which the VPD in the tree crowns was reduced show higher sap flow values compared to the trees without VPD reduction.
Further information and high-resolution historical and current data series are available under real-time data.